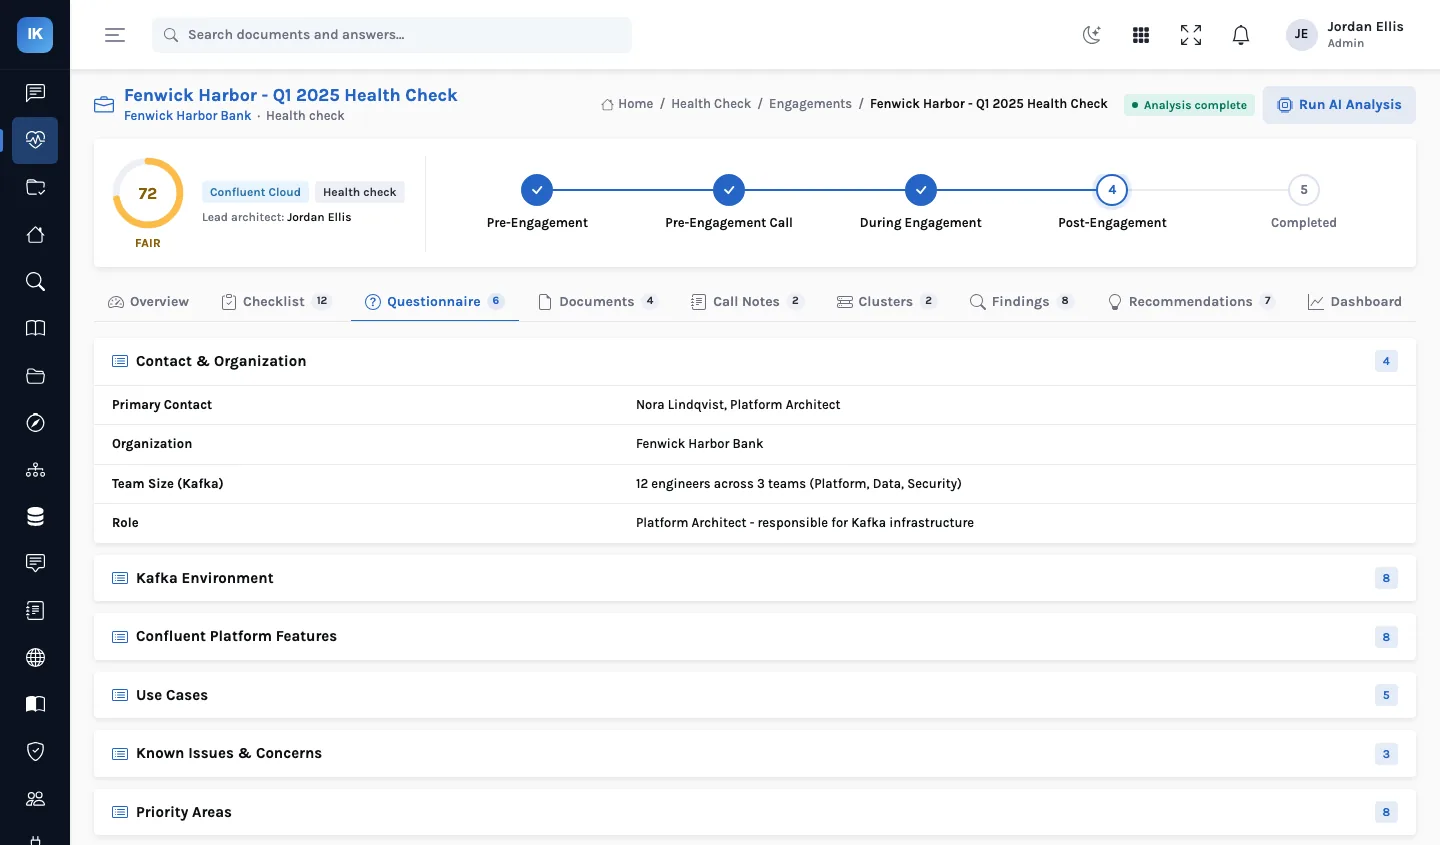
A health score is only useful if the person receiving it can ask “why 72?” and get an answer. In InsightKafka the analysis that produces findings uses a language model, but the score is arithmetic on those findings, with published weights and deductions. This article walks through both.
The analysis: seven categories, in order
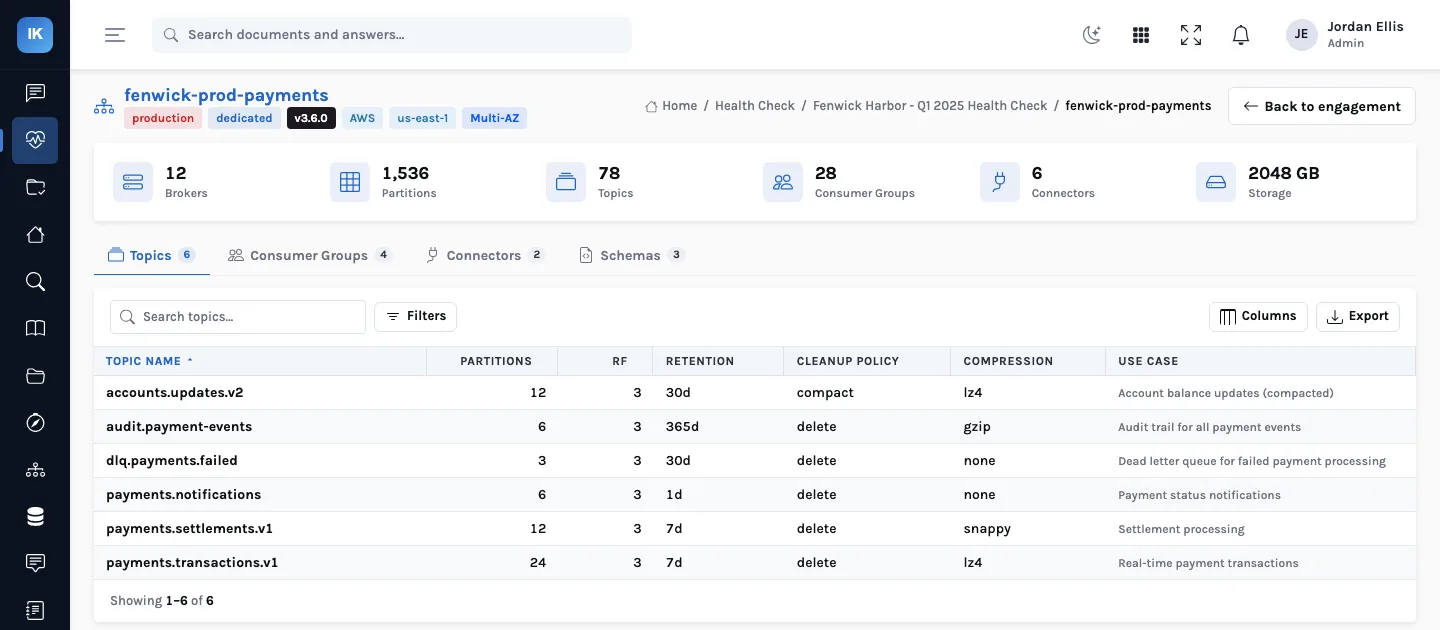
When an architect runs the AI analysis on an engagement, InsightKafka works through seven categories in turn (architecture, topics, consumers, connectors, security, monitoring and governance), each step reading the part of the engagement it needs (the cluster records with their topics, consumer groups, connectors and schemas, and the security, monitoring and governance details found in parsed documents and cluster settings) with instructions specific to that category. Call notes and the checklist are not sent to the model; they inform the architect's own findings. The observations are then turned into findings (title, severity, category, detail, evidence, impact, current state, confidence) and recommendations (priority, effort, implementation steps and links to vendor documentation).
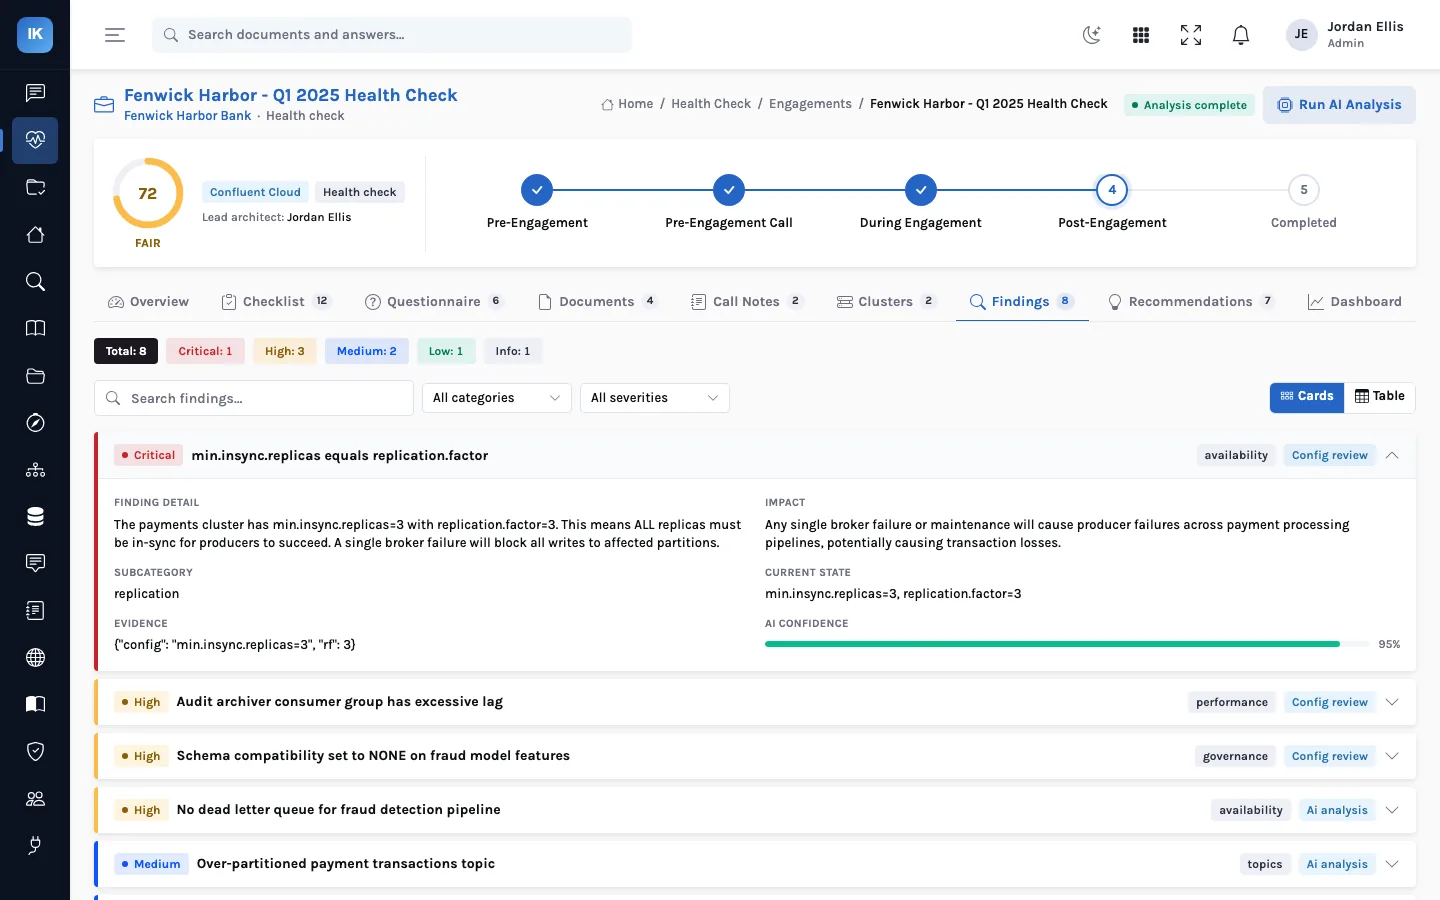
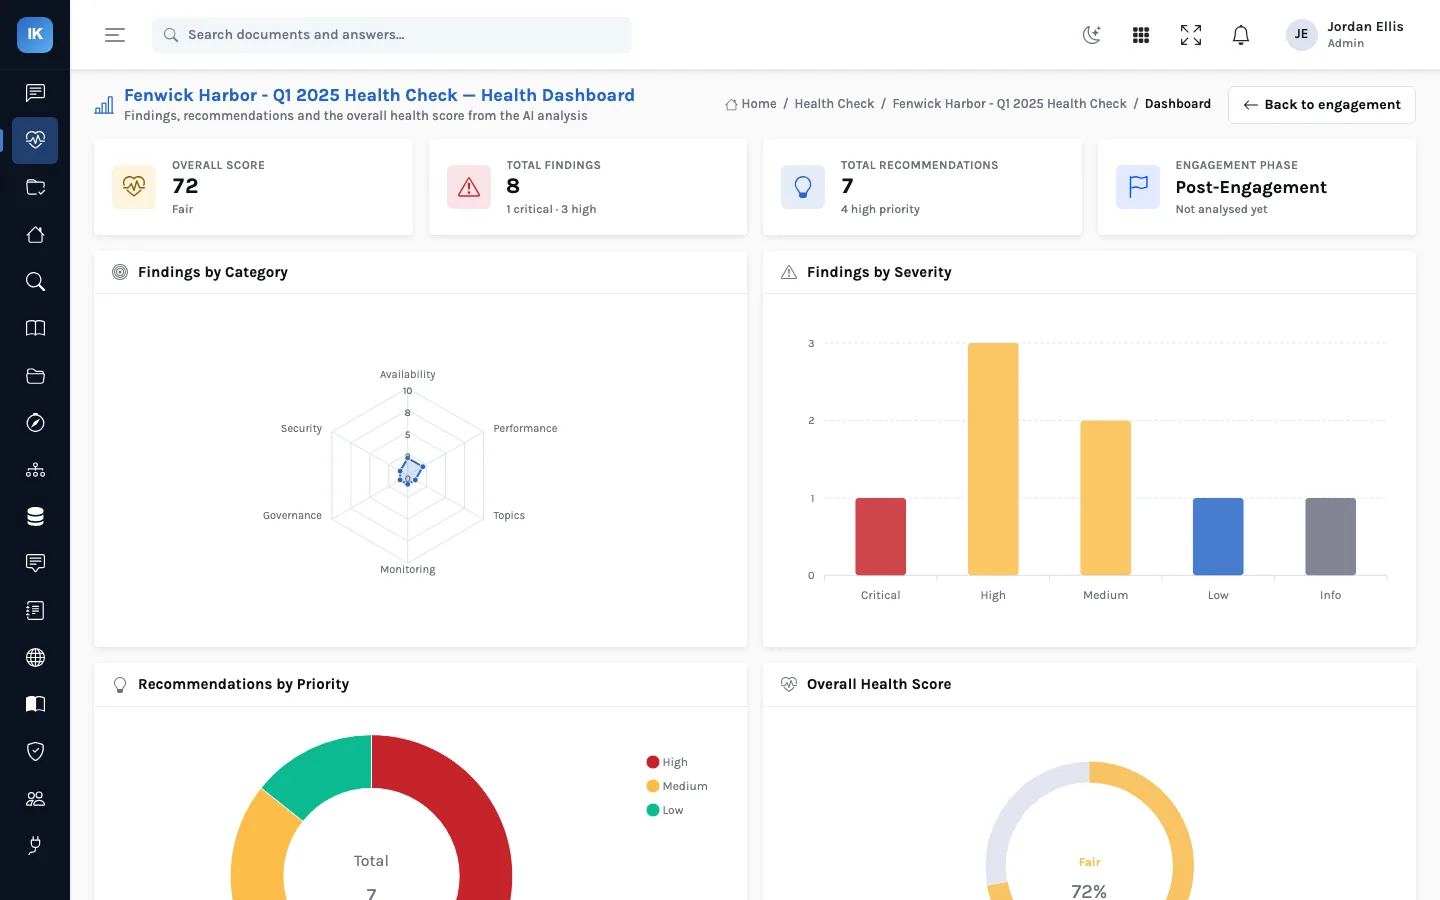
A finding can also carry a more specific label, such as availability or performance, which is what the dashboard's category chart shows. Every finding records its source (configuration review, AI analysis or call notes), so a reviewer can see which ones came from a rule, which from the model, and which from what the customer said.
The score: 100 minus deductions, weighted
Each category starts at 100 and loses points for each finding in it: 25 for a critical, 15 for a high, 8 for a medium, 3 for a low and none for an informational finding, never going below zero. The overall score is the weighted average of the seven categories:
| Category | Weight | Findings | Category score | Weighted |
|---|---|---|---|---|
| Architecture | 0.20 | high | 100 − 15 = 85 | 17.0 |
| Topics | 0.15 | medium, low | 100 − 11 = 89 | 13.3 |
| Consumers | 0.15 | high | 100 − 15 = 85 | 12.8 |
| Connectors | 0.10 | none | 100 − 0 = 100 | 10.0 |
| Security | 0.20 | critical | 100 − 25 = 75 | 15.0 |
| Monitoring | 0.10 | medium | 100 − 8 = 92 | 9.2 |
| Governance | 0.10 | high | 100 − 15 = 85 | 8.5 |
| Overall | 1.00 | 86 |
The example above is worked by hand with a made-up set of findings. Security and architecture carry the most weight (0.20 each), because a problem there tends to put the whole platform at risk; topics and consumers 0.15 each; connectors, monitoring and governance 0.10 each. The dashboard bands the result: 80 and above healthy, 60 to 79 fair, under 60 at risk.
Why this split matters
- The model drafts, the architect decides. Findings can be edited, removed or added (by an administrator) before the report is generated, so what the customer reads is what the architect stands behind.
- Two engagements are comparable. The same weights and deductions apply to every customer, so 72 and 58 mean the same thing across a portfolio.
- The score cannot hide a critical issue. One critical security finding costs that category 25 points and the overall score 5, which is visible in the table above rather than averaged away.
What moves the score
Because the weights differ, the same finding is worth different amounts in different categories. Using the deductions and weights above:
| Fixing one… | Category points recovered | Overall points recovered |
|---|---|---|
| Critical in security or architecture | 25 | 5.0 |
| High in security or architecture | 15 | 3.0 |
| High in topics or consumers | 15 | 2.25 |
| High in connectors, monitoring or governance | 15 | 1.5 |
| Medium anywhere weighted 0.10 | 8 | 0.8 |
That is a useful way to order a remediation plan when effort is similar, but not the only one: a high in connectors that is losing data today matters more than its 1.5 points. There is also a floor. Four criticals take a category to zero, and a fifth changes nothing, so a category at zero needs its findings read, not its number.
When the score is set, and what that means for edits
- The score is calculated at the end of an analysis run, from the findings that run produced. Findings added by hand, or recorded from configuration review or call notes, are kept and shown, but they do not change the stored score.
- Editing or deleting findings afterwards does not recalculate it either. If your edits change the picture, say so in the executive summary, or re-run the analysis.
- Re-running replaces every AI-generated finding and recommendation, including any you edited, and keeps the others. Do your editing after the last run.
- If a category's analysis fails, it records an informational “Analysis Error” finding. Informational findings cost nothing, so that category scores 100. Check for those before you quote a score.
Reviewing drafted recommendations
Recommendations are drafted from the findings, five to fifteen of them, ordered high, medium, low, each with steps, an effort estimate and links to vendor documentation. The links are written by the model, so open each one before it goes in a report; a plausible-looking URL is not always a real page.
Questions
Why do the dashboard bands differ from the label stored with the analysis?
The analysis also stores a coarser level (from excellent down to critical) alongside the number. The dashboard and this blog use the bands shown on screen: 80 and above healthy, 60 to 79 fair, under 60 at risk. Quote the number and the on-screen band.
Can we change the weights?
They are constants in the analysis engine, the same for every engagement, which is what makes scores comparable. Changing them is a code change, and it makes earlier scores incomparable with later ones.
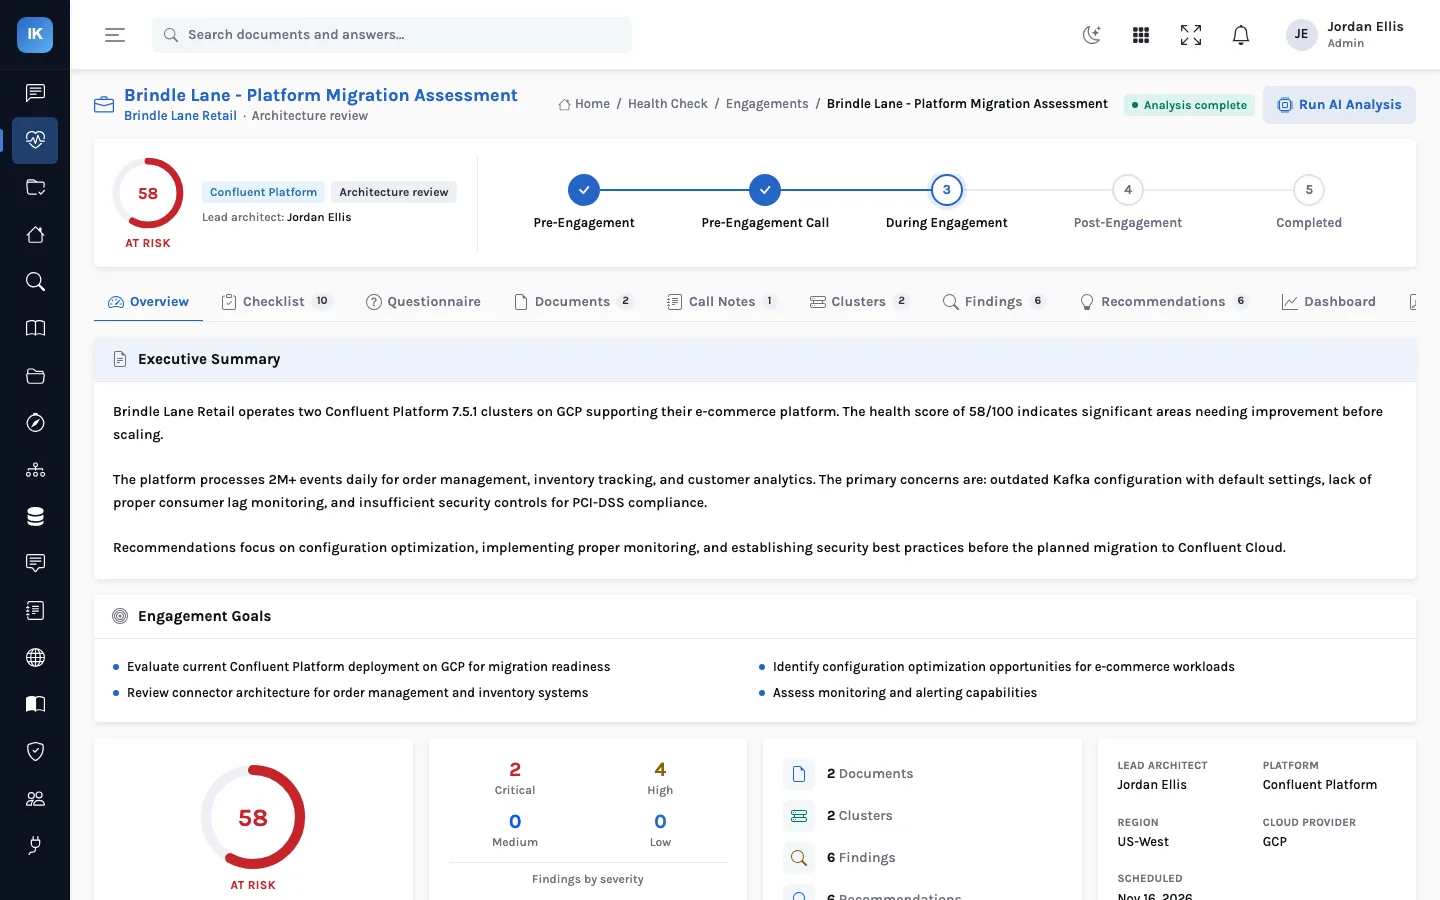
Explaining a 58
The fictional Brindle Lane Retail's migration assessment scores 58, at risk, and its platform lead asks why. The architect opens the findings rather than the gauge: two criticals (SASL/PLAIN authentication with no ACLs, and a clickstream topic with too low a replication factor) and four highs (no Schema Registry, a failed BigQuery sink connector, no alerting, a single availability zone). Each critical costs its category 25 points and each high 15, so the two criticals are both the biggest risks and the quickest way to move the score. That is the first slide of the read-out.